Factorio Recipe Visualization

Introduction
I really like the game Factorio (Steam page). It is a factory building game about optimizing production. As you progress in the game, you have to build more factories for new items. These new items depend on the production of existing items. To make it further in the game, you have to continually produce new items while increasing the production output of existing materials. For example, the “Electronic Circuit” is a very common intermediate product to build and it can be difficult to produce enough on a production line to satisfy all the end game requirements. It leads to a lot of underground belts and ‘snaking’ around when planned poorly. Factories, therefore, can become complex and difficult to plan ahead. Thus, I built this visualization to help make factory planning easier.
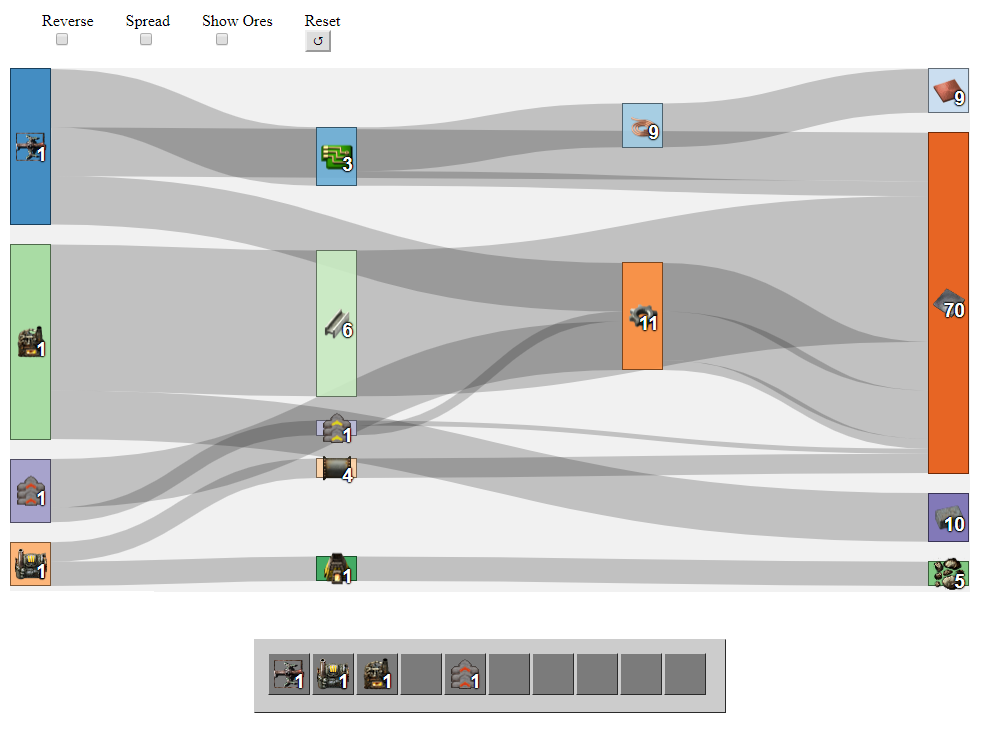
 **Notice how the electronic circuits (green items marked in red) are depended by the assembling machines (marked green) that produce many different kinds of items. What I was going for was building a scalable row of assemblers where I can produce a single item and increase the number of assembly machines when needed. Especially when I need more express transport belts.**
I choose a Sankey diagram to visualize the recipe data because I wanted to show two key relationships: (1) what items and intermediate products the recipe depends on, and (2) how much in relation do each of the items are required. The Sankey diagram produced shows how the items depend on each other but also the ratios of their contribution. Furthermore, by adding multiple items to visualize, you can also compare different objects to see how recipes depend on different intermediate products and by how much they depend.
I also based the interface off Factorio’s interface as well. I developed a web-based version of the item inventory where users can intuitively use the visualization based on the original game’s controls. Such as placing items in the item bar or pressing ‘e’ to open the inventory menu.
To make maintenance of the underlying database easier to maintain, I open-sourced the database in a separate repository. Most of the information was sourced from Factorio’s official Wiki. As the game updates with new recipes, the recipes can be updated easily by updating the repository. Furthermore, this database is open to anyone who wants to work with the game’s data. If anyone finds an issue in the database, they can easily submit a pull request to make changes.
Lastly, in both repositories I used Travis CI to automatically publish and update the Visualization and database website whenever their respective GitHub repositories are updated. All in Factorio’s spirit of automation!
Check out the repositories here:
Visualization (GitHub)
Recipes (GitHub)
Limitations
I do want to acknowledge that by using the visualization can lead to factories looking like well-organized trees. While personally I like building neat tree style production lines, I still find creative value in developing complex factories. They help you make progress in the game to get access to better equipment and research. It is very challenging to build great factory in your first few runs. My suggestion is to perhaps use this tool to help build small modular factories that are good at producing one particular item and not as a complete walkthrough for how to layout your factory.
