PCPartsPicker Visualization
Tools: D3.js, JQuery, HTML, CSS, Javascript, Tableau, Trifacta Wrangler, Web Scraping
About
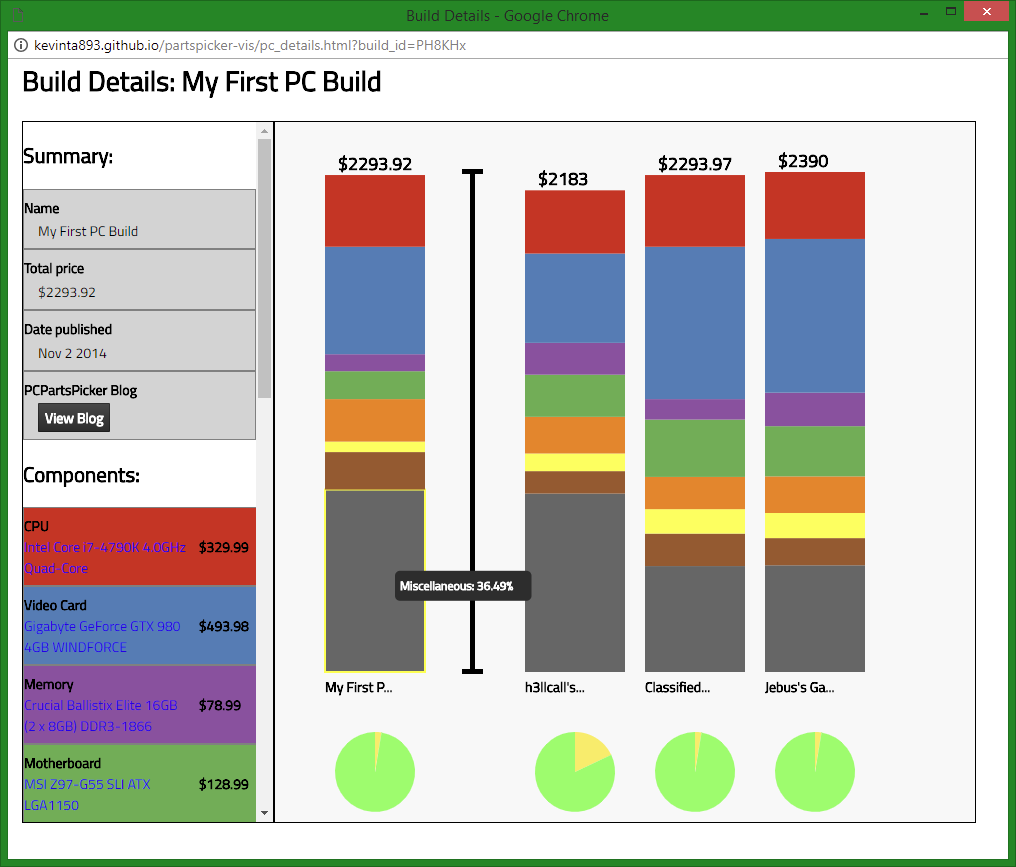 **The pop-up menu that visualizes a single build and its breakdown of the budgeting in part categories compared to other PC builds of a similar price range. **
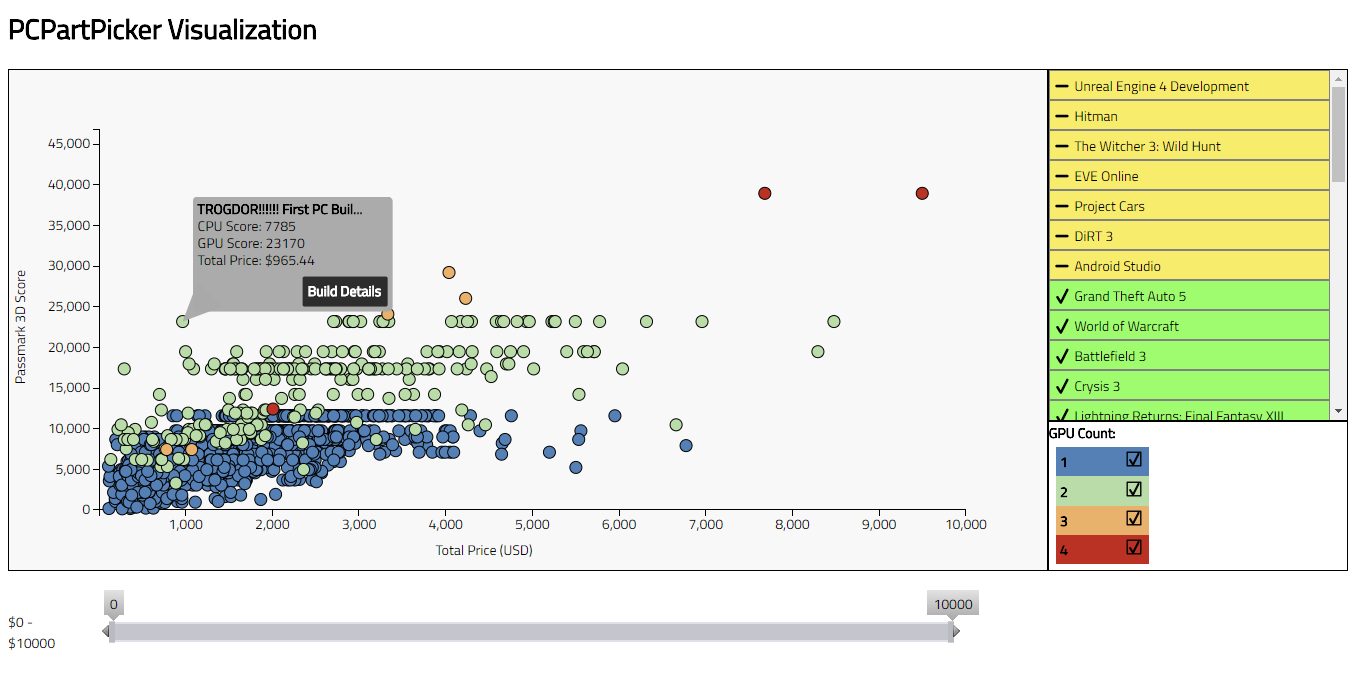
PC building is a popular hobby among gamers and computer enthusiasts alike. While the essential part types needed to build a computer has not changed, there is a large number of possible configurations that focus on either performance, price, or aesthetics. For newcomers, picking parts can take a long time a since considerable amount is spent on sifting through online reviews, specifications, and compatibility lists for each part. Furthermore higher tier parts tend to have premium pricing which is money that could be spend on other parts and accessories. To aid users in picking parts for their next computer build, I have built a visualization that allows users to explore existing completed computer builds to help them pick parts and devise a budgeting plan. Using data from [pcpartspicker.com](https://ca.pcpartpicker.com/), the visualization aids users in exploring computer builds and how they are budgeted. A user can learn from can learn from other builders since each build has well documented build logs, photos, and user comments. In addition, to help users compare builds, benchmark data for CPUs and GPUs was used to measure the performance of each build. Using this data, the visualization can give a rough measure the performance of a particular build and compare that against software requirements for games and commercial software. This helps the price to performance
**The pop-up menu that visualizes a single build and its breakdown of the budgeting in part categories compared to other PC builds of a similar price range. **
PC building is a popular hobby among gamers and computer enthusiasts alike. While the essential part types needed to build a computer has not changed, there is a large number of possible configurations that focus on either performance, price, or aesthetics. For newcomers, picking parts can take a long time a since considerable amount is spent on sifting through online reviews, specifications, and compatibility lists for each part. Furthermore higher tier parts tend to have premium pricing which is money that could be spend on other parts and accessories. To aid users in picking parts for their next computer build, I have built a visualization that allows users to explore existing completed computer builds to help them pick parts and devise a budgeting plan. Using data from [pcpartspicker.com](https://ca.pcpartpicker.com/), the visualization aids users in exploring computer builds and how they are budgeted. A user can learn from can learn from other builders since each build has well documented build logs, photos, and user comments. In addition, to help users compare builds, benchmark data for CPUs and GPUs was used to measure the performance of each build. Using this data, the visualization can give a rough measure the performance of a particular build and compare that against software requirements for games and commercial software. This helps the price to performance